
Machine learning is often introduced through a simple idea: give a model examples, tell it what the correct answer is, and let it learn the pattern.
That’s supervised learning.
But what happens when you don’t have the answers?
What if you have thousands of customer records, millions of transactions, sensor readings from a factory, or a huge collection of documents—but nobody has labeled them?
That’s where unsupervised learning becomes useful.
Instead of learning from predefined labels, an unsupervised learning algorithm looks for meaningful structures, patterns, relationships, similarities or unusual observations within the data itself.
This makes unsupervised learning particularly valuable when labeled datasets are expensive, incomplete or simply unavailable.
From customer segmentation and fraud detection to image processing, recommendation systems and industrial monitoring, unsupervised learning is already part of many practical machine learning systems.
Table of Contents
What Is Unsupervised Learning?
Unsupervised learning is a type of machine learning in which an algorithm learns patterns from data without being given predefined output labels.
In supervised learning, a dataset might look like this:
| Input | Label |
|---|---|
| Customer A | High-value customer |
| Customer B | Low-value customer |
| Customer C | High-value customer |
The model learns to predict the label.
With unsupervised learning, the labels aren’t provided.
Instead, the data might simply look like:
| Customer | Spending | Visits | Products |
|---|---|---|---|
| A | 80,000 | 24 | 18 |
| B | 5,000 | 3 | 2 |
| C | 62,000 | 19 | 15 |
| D | 7,500 | 5 | 4 |
The algorithm has to determine whether meaningful groups or patterns exist.
It might discover that customers naturally fall into three clusters:
- Frequent high-value customers
- Occasional customers
- Low-engagement customers
Nobody explicitly told the algorithm those categories.
It discovered the structure from the data.
That’s the core idea behind unsupervised machine learning.
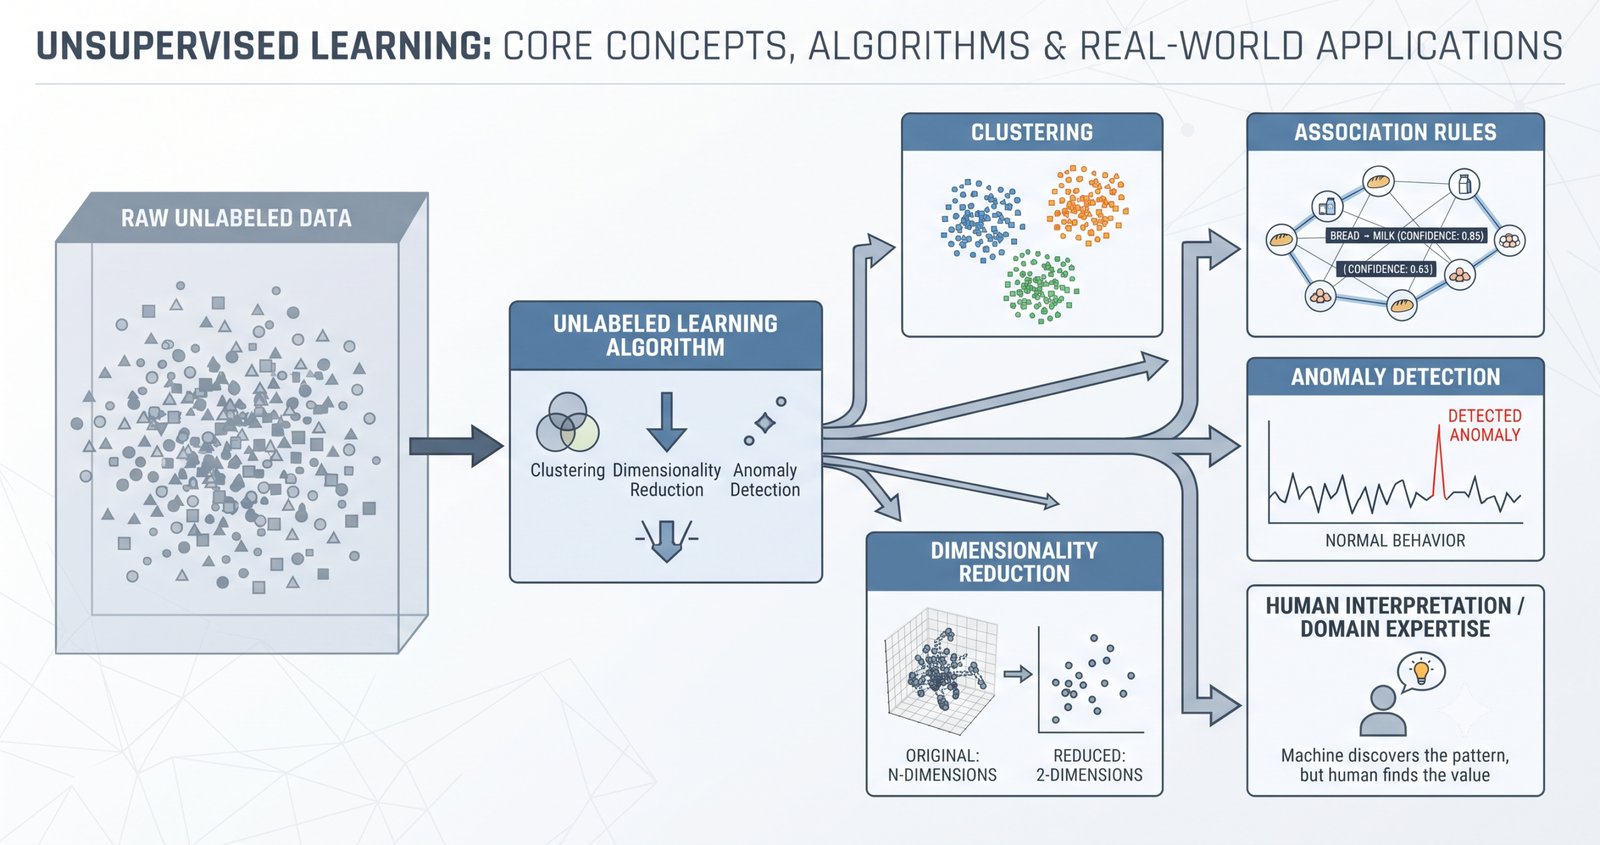
How Unsupervised Learning Works
At a high level, the process looks like this:
Raw data
↓
Data preprocessing
↓
Feature representation
↓
Unsupervised learning algorithm
↓
Patterns / clusters / relationships / anomalies
↓
Human interpretation
That last step is important.
An unsupervised algorithm can identify a pattern, but engineers and domain experts still need to determine whether that pattern is useful.
For example, a clustering algorithm may divide customers into four groups.
That doesn’t automatically mean there are four meaningful customer segments.
Someone still needs to examine the clusters and understand what makes them different.
Why Use Unsupervised Learning?
The biggest advantage is that you don’t need a fully labeled dataset.
Creating labels can be expensive.
Imagine trying to label:
- Millions of customer interactions
- Thousands of medical images
- Years of machine sensor data
- Millions of documents
- Large collections of network traffic
Human experts would need to examine and categorize the data.
That can take enormous amounts of time.
Unsupervised learning can instead explore the data first and help engineers discover structure that wasn’t obvious beforehand.
This makes it especially useful for exploratory data analysis and discovering previously unknown patterns.
The Main Types of Unsupervised Learning
Unsupervised learning isn’t one algorithm.
It’s a broad category containing several different approaches.
The most important ones include:
- Clustering
- Dimensionality reduction
- Association rule learning
- Anomaly detection
- Representation learning
Each solves a different kind of problem.
1. Clustering
Clustering is probably the most recognizable application of unsupervised learning.
The objective is to group similar data points together.
Imagine plotting thousands of customers based on:
- Annual spending
- Number of purchases
You might notice that the points naturally form several groups.
A clustering algorithm attempts to identify those groups mathematically.
Common clustering algorithms include:
- K-means
- Hierarchical clustering
- DBSCAN
- Gaussian mixture models
- Mean Shift
The appropriate algorithm depends on the structure of your data.
K-Means Clustering
K-means is one of the most widely used clustering algorithms.
The basic idea is straightforward.
You choose the number of clusters, K, and the algorithm attempts to divide the observations into those groups.
A simplified process looks like this:
- Choose K cluster centers.
- Assign each data point to its nearest center.
- Recalculate the center of each cluster.
- Reassign the points.
- Repeat until the clusters stabilize.
For example, if you’re segmenting customers and choose:
K = 3
the algorithm will attempt to create three customer groups based on the features you’ve provided.
The challenge is that you need to decide an appropriate value for K.
Methods such as the elbow method and silhouette analysis can help evaluate candidate values.
Hierarchical Clustering
Hierarchical clustering takes a different approach.
Instead of immediately assigning every observation to one of a fixed number of groups, it builds a hierarchy of relationships.
The result can be visualized as a tree-like structure called a dendrogram.
This can be useful when engineers want to understand relationships at multiple levels.
For example:
All customers
→ High-value / low-value
→ High-value → frequent / occasional
→ Frequent → premium / standard
The hierarchy can provide more insight than simply saying “there are five clusters.”
DBSCAN
DBSCAN (Density-Based Spatial Clustering of Applications with Noise) groups points based on density.
This gives it an important advantage over K-means in certain situations.
K-means generally works best when clusters have relatively well-behaved shapes.
DBSCAN can identify clusters with more irregular shapes and can also identify points that don’t belong to a dense cluster.
Those unusual points can be treated as noise.
This makes DBSCAN useful for some applications involving:
- Geographic data
- Sensor measurements
- Spatial analysis
- Anomaly identification
2. Dimensionality Reduction
Real-world datasets can contain hundreds or thousands of features.
Working with all of them can create problems.
High-dimensional datasets may:
- Require more computational resources
- Contain redundant information
- Be difficult to visualize
- Make some algorithms less effective
- Increase the complexity of downstream models
Dimensionality reduction attempts to represent high-dimensional data using fewer dimensions while retaining important information.
One of the most widely known techniques is Principal Component Analysis (PCA).
Principal Component Analysis (PCA)
PCA transforms the original variables into a smaller set of new variables called principal components.
The first component captures as much of the variation in the data as possible.
The next component captures as much of the remaining variation as possible, subject to being independent of the earlier components in the PCA sense.
This allows engineers to represent complex datasets using fewer dimensions.
For example:
100 original features
↓
PCA
↓
10 principal components
The resulting representation can be much easier to visualize and process.
PCA is often used for:
- Data visualization
- Feature compression
- Noise reduction
- Exploratory analysis
- Preprocessing for other machine learning algorithms
t-SNE and UMAP
Other dimensionality-reduction methods are often used when visualization is the primary goal.
t-SNE (t-distributed stochastic neighbor embedding) is designed to preserve local relationships and is frequently used to visualize high-dimensional data in two or three dimensions.
UMAP (Uniform Manifold Approximation and Projection) is another popular technique for visualizing high-dimensional datasets while attempting to preserve important structural relationships.
These methods can be extremely useful for exploration.
However, engineers should be careful not to interpret a two-dimensional visualization as proof that the original data has exactly the same structure.
A visualization is a tool for understanding the data—not necessarily the final model.
3. Association Rule Learning
Association rule learning looks for relationships between items or events.
A classic example is retail.
Suppose a store has thousands of transactions.
The data may reveal that customers who purchase one type of product frequently purchase another.
This can lead to rules such as:
Customers who purchase A → are more likely to purchase B
Two common concepts are:
- Support
- Confidence
Another commonly used measure is lift.
These help determine whether an apparent relationship is frequent and meaningful rather than simply coincidental.
Association rule learning is commonly associated with techniques such as Apriori and FP-Growth.
4. Anomaly Detection
Not every useful pattern is a group.
Sometimes the interesting observation is the one that doesn’t fit.
That’s the idea behind anomaly detection.
An anomaly detection system attempts to identify observations that differ significantly from the expected behavior.
For example:
A factory sensor normally reports temperatures between 60°C and 70°C.
Suddenly it reports:
115°C
That reading deserves attention.
Similarly, unusual behavior can occur in:
- Financial transactions
- Network traffic
- Industrial machinery
- Login activity
- Medical measurements
- Application performance
Unsupervised anomaly detection can help identify these unusual observations even when historical examples of every possible failure aren’t available.
5. Representation Learning
Modern machine learning systems often need useful representations of raw data.
Instead of manually designing every feature, representation learning methods attempt to learn useful structures automatically.
This idea is particularly important in deep learning.
For example, an algorithm might learn representations of:
- Images
- Text
- Audio
- Sensor signals
Those representations can then be used by other machine learning systems.
Self-supervised learning has become particularly important in this area because it can create learning signals from the data itself, although self-supervised learning is generally treated as a distinct learning paradigm rather than simply being synonymous with traditional unsupervised learning.
Unsupervised Learning vs Supervised Learning
The difference becomes much clearer when you compare the training data.
| Feature | Supervised Learning | Unsupervised Learning |
|---|---|---|
| Labels required | Yes | No |
| Primary goal | Predict known outcomes | Discover structure |
| Typical tasks | Classification, regression | Clustering, dimensionality reduction |
| Human labeling | Usually required | Usually not required |
| Output | Predicted label/value | Groups, patterns, representations or anomalies |
| Example | Predict whether a transaction is fraudulent | Discover unusual transaction patterns |
Neither approach is automatically better.
The right choice depends on the problem and the available data.
Unsupervised Learning vs Semi-Supervised Learning
There is also a middle ground.
In semi-supervised learning, a model uses a combination of labeled and unlabeled data.
For example:
- 10,000 images available
- 500 images manually labeled
- 9,500 images unlabeled
Instead of ignoring the unlabeled data, a semi-supervised approach can use both sources.
This can be useful when obtaining labels is expensive but large amounts of raw data are readily available.
Unsupervised Learning vs Self-Supervised Learning
These terms are often mixed together.
Self-supervised learning creates training targets from the data itself.
For example, a model may hide part of an input and learn to predict the missing information.
Large modern AI models frequently rely on self-supervised objectives during pretraining.
Traditional unsupervised learning, meanwhile, usually refers more directly to techniques that discover structure without explicit target labels—for example, clustering or dimensionality reduction.
The distinction matters when discussing modern AI systems.
Real-World Applications of Unsupervised Learning
The usefulness of unsupervised learning becomes clearer when you look at where it can be applied.
Customer Segmentation
Companies can group customers based on behavior rather than relying only on predefined demographic categories.
Features might include:
- Purchase frequency
- Average order value
- Product preferences
- Website activity
- Customer lifetime value
The resulting clusters can support more targeted marketing and customer strategies.
Fraud Detection
Fraud evolves quickly.
A system trained only on previously identified fraud patterns can struggle when attackers change their behavior.
Unsupervised techniques can help identify transactions that behave differently from the normal population.
For example:
Normal transaction pattern
versus
Unusual location + unusual amount + unusual time + unusual device
The unusual combination can trigger further investigation.
Unsupervised learning does not automatically prove that a transaction is fraudulent.
It identifies patterns that deserve attention.
Cybersecurity
Network environments generate enormous quantities of data.
Unsupervised learning can help identify unusual patterns in:
- Network traffic
- Login behavior
- Device activity
- User behavior
- System events
This can support intrusion detection and security monitoring.
Recommendation Systems
Recommendation engines can use patterns in user behavior to identify similarities.
For example:
If users who interact with products A, B and C also frequently interact with D, the system can use that relationship to generate recommendations.
Large-scale recommendation systems often combine multiple machine learning approaches rather than relying exclusively on traditional unsupervised learning.
Image Processing
Unsupervised techniques can help organize large image collections by visual similarity.
For example, millions of images can potentially be represented as numerical feature vectors and then grouped according to similarity.
This can assist with:
- Image organization
- Duplicate detection
- Visual search
- Image exploration
- Feature extraction
Natural Language Processing
Text can also be represented mathematically.
Unsupervised or self-supervised techniques can identify relationships between documents, words and semantic representations.
Applications include:
- Document clustering
- Topic discovery
- Similarity search
- Text organization
- Semantic representation
For example, thousands of customer-support tickets can be grouped into themes without manually assigning every ticket to a category first.
Manufacturing and Predictive Maintenance
Industrial equipment generates large amounts of sensor data.
An unsupervised model can learn what normal machine behavior looks like.
When the sensor pattern changes significantly, the system can flag it for inspection.
This is useful when there are relatively few examples of actual equipment failures.
Instead of asking:
“Does this look exactly like a failure we’ve seen before?”
the system can ask:
“Does this look significantly different from normal behavior?”
That’s a powerful distinction.
Unsupervised Learning in Engineering
For engineers, unsupervised learning can be particularly useful because many engineering systems produce large amounts of unlabeled data.
Consider a manufacturing facility.
Sensors may continuously record:
- Temperature
- Pressure
- Vibration
- Current
- Speed
- Flow rate
It may be impossible to label every measurement manually.
An unsupervised system can first learn the normal operating patterns.
Later, unusual combinations can be investigated.
This creates a practical engineering workflow:
Sensors → Data pipeline → Feature representation → Unsupervised model → Anomaly detection → Engineer review
The model doesn’t replace the engineer.
It helps the engineer focus attention where it matters.
Advantages of Unsupervised Learning
Works Without Large Labeled Datasets
This is its biggest advantage.
Organizations can begin exploring large datasets without manually labeling everything.
Discovers Hidden Patterns
The algorithm can uncover relationships that weren’t anticipated when the dataset was collected.
Useful for Exploratory Analysis
It can help engineers understand an unfamiliar dataset before building predictive models.
Supports Automation
Clustering and anomaly detection can automate parts of data analysis and monitoring.
Scales to Large Datasets
Many unsupervised algorithms can process datasets that would be difficult for humans to inspect manually.
Limitations of Unsupervised Learning
Unsupervised learning isn’t magic.
It has some significant limitations.
Results Can Be Difficult to Interpret
A mathematical cluster isn’t automatically a meaningful real-world category.
Choosing the Right Algorithm Matters
Different algorithms make different assumptions about the data.
Parameter Selection Can Be Difficult
For example, K-means requires choosing K.
DBSCAN requires appropriate density parameters.
Poor choices can produce misleading results.
Noise Can Affect Results
Real-world datasets are rarely clean.
Outliers, missing values and irrelevant features can distort the discovered structure.
Evaluation Is More Complicated
With supervised learning, you can often compare predictions against known labels.
With unsupervised learning, there may be no single “correct” answer.
A technically valid cluster isn’t necessarily a useful cluster.
How to Evaluate an Unsupervised Learning Model
Because there may not be ground-truth labels, evaluation requires more thought.
For clustering, engineers may use metrics such as:
Silhouette Score
Measures how similar an observation is to its own cluster compared with other clusters.
Davies-Bouldin Index
Evaluates cluster separation and compactness.
Calinski-Harabasz Index
Looks at the relationship between within-cluster and between-cluster dispersion.
But numerical metrics aren’t enough.
A cluster can score well mathematically while being useless to the business.
Domain validation is therefore important.
Ask:
Does the discovered pattern actually help us make a better decision?
That’s often the most important evaluation criterion.
Data Preprocessing Matters More Than You Think
Unsupervised algorithms are highly sensitive to the way data is represented.
Consider two features:
Annual income: ₹1,000,000
Number of purchases: 20
The numerical scales are very different.
An algorithm based on distance could give disproportionate importance to income simply because the numbers are larger.
Techniques such as normalization or standardization can help ensure that features contribute more appropriately.
Engineers also need to consider:
- Missing values
- Outliers
- Duplicate records
- Irrelevant features
- Categorical variables
- Feature distributions
Garbage in, garbage out applies just as much to unsupervised learning as it does elsewhere in machine learning.
Choosing the Right Unsupervised Learning Algorithm
There is no universal best algorithm.
The choice depends on what you are trying to discover.
| Problem | Possible Techniques |
|---|---|
| Customer grouping | K-means, hierarchical clustering |
| Irregular spatial clusters | DBSCAN |
| High-dimensional visualization | PCA, UMAP, t-SNE |
| Product associations | Apriori, FP-Growth |
| Unusual observations | Isolation Forest, clustering-based methods |
| Complex feature representation | Autoencoders / representation learning |
The data itself should influence the decision.
Don’t choose K-means simply because it is the algorithm everyone learned first.
A Practical Unsupervised Learning Workflow
A real project might follow this process:
Step 1: Define the Objective
Decide what you want to discover.
Step 2: Collect Data
Bring together the relevant sources.
Step 3: Clean the Dataset
Handle missing values, duplicates and obvious errors.
Step 4: Select Features
Choose variables that actually represent the problem.
Step 5: Explore the Data
Use statistics and visualizations to understand distributions and relationships.
Step 6: Select an Algorithm
Choose a technique appropriate for the structure of your data.
Step 7: Train the Model
Run the algorithm on the prepared dataset.
Step 8: Evaluate the Results
Use appropriate metrics and domain knowledge.
Step 9: Interpret the Patterns
Determine what the discovered structures actually mean.
Step 10: Put the Results to Work
Integrate useful findings into a business or engineering workflow.
This final step is what separates an interesting experiment from a useful machine learning system.
A Simple Example of Unsupervised Learning
Imagine an ecommerce company has 100,000 customers.
The company knows:
- How frequently each customer purchases
- How much they spend
- Which categories they browse
- How often they return
- How long they remain active
But it doesn’t have predefined customer segments.
A team could use clustering.
The workflow might be:
Customer data
↓
Feature engineering
↓
Scaling
↓
K-means clustering
↓
Five customer groups
↓
Business interpretation
The resulting groups might reveal patterns such as:
- High-frequency premium customers
- Discount-driven shoppers
- Occasional customers
- New customers
- Customers at risk of becoming inactive
The algorithm doesn’t know these labels beforehand.
The business team interprets the discovered clusters afterward.
That is unsupervised learning in practice.
Unsupervised Learning in Modern AI
Unsupervised learning also helps explain an important shift in artificial intelligence.
Historically, machine learning systems often depended heavily on labeled datasets.
Modern AI systems increasingly learn from enormous amounts of raw data.
Self-supervised learning has played a major role in this transition.
Instead of manually labeling every piece of data, training objectives can be constructed from the data itself.
This has enabled models to learn powerful representations of:
- Language
- Images
- Audio
- Video
- Code
Traditional unsupervised techniques such as clustering and dimensionality reduction remain useful, while modern representation-learning approaches have expanded the broader idea of learning structure from unlabeled data.
The Future of Unsupervised Learning
The amount of unlabeled data generated around the world continues to grow.
Businesses collect information from:
- Sensors
- Applications
- Websites
- Machines
- Cameras
- Customer interactions
- Networks
- Documents
The challenge is no longer simply collecting data.
It is finding useful structure inside it.
That makes unsupervised and self-supervised approaches increasingly important.
At the same time, the most effective systems are likely to combine multiple learning paradigms.
A production machine learning system might use:
Unsupervised learning → Discover patterns
Supervised learning → Predict known outcomes
Self-supervised learning → Learn useful representations
Human expertise → Validate decisions
The future isn’t about choosing one approach.
It’s about using the right approach for each part of the problem.
Final Thoughts
Unsupervised learning gives machines a way to learn from data when explicit answers aren’t available.
Its core techniques—particularly clustering, dimensionality reduction, association rule learning and anomaly detection—help engineers discover structure that may otherwise remain hidden inside large datasets.
But the real value doesn’t come from producing clusters or colorful visualizations.
It comes from turning those discoveries into something useful.
A manufacturing engineer can use anomaly detection to investigate unusual machine behavior.
A retailer can use clustering to understand customer segments.
A cybersecurity team can identify unusual network activity.
A data scientist can use dimensionality reduction to understand a complex dataset.
In each case, the algorithm is only one part of the solution.
The important question is always the same:
What can we learn from the data that helps us make a better decision?
That’s where unsupervised learning becomes more than a machine learning concept—and becomes a practical engineering tool.
Have any thoughts?
Share your reaction or leave a quick response — we’d love to hear what you think!
-
 0
0 - 0
- 0



